 Friday, April 26, 2024
HP Beats Q3 with Strong Results
HP Beats Q3 with Strong Results
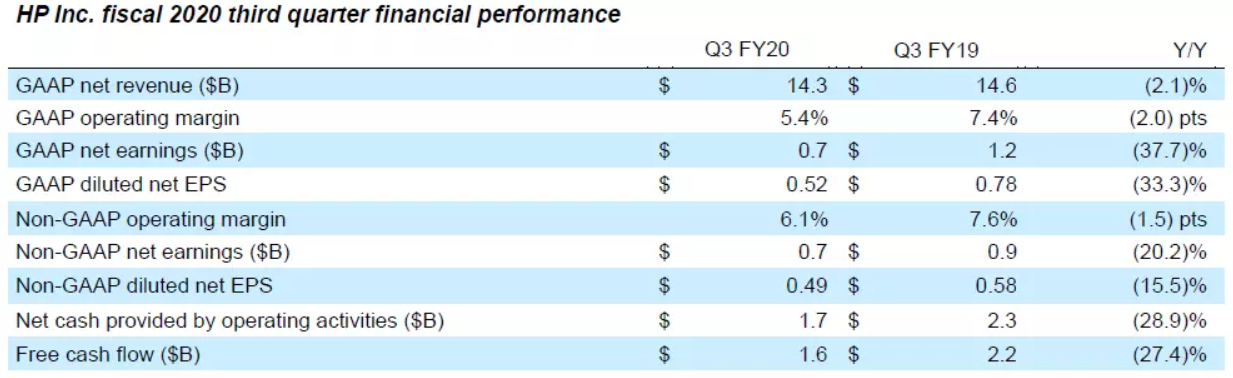
HP Inc. and its subsidiaries (“HP”) announced net revenue in third quarter 2020 (Q3, 2020) to be $14.3 billion, down 2.1% (down 0.2% in constant currency) from the prior-year period.
Some other highlights include:
- GAAP diluted net EPS was $0.52, down from $0.78 in the prior-year period and above the previously provided outlook of $0.35 to $0.41.
- Non-GAAP diluted net EPS was $0.49, down from $0.58 in the prior-year period and above the previously provided outlook of $0.39 to $0.45.
- Non-GAAP net earnings and non-GAAP diluted net EPS exclude after-tax adjustments of $32 million, or $0.03 per diluted share, related to restructuring and other charges, acquisition-related charges (credits), amortization of intangible assets, non-operating retirement-related (credits)/charges, debt extinguishment costs and tax adjustments.

“Our strong Q3 results and solid beat for the quarter, in the face of unprecedented uncertainty, reflects the agility of our teams and the strength of our portfolio,” said Enrique Lores (pictured below), HP’s President and CEO. “We’re leveraging our leadership across consumer and commercial markets to capitalize on opportunities – from the essential role of the PC in an era of remote work and school to the rise of subscription-based business models to enable greater flexibility. Our diverse portfolio and disciplined execution are powering our performance and we’re well-positioned to drive continued value creation.”
By segment
- Personal Systems net revenue was up 7% year over year (up 9% in constant currency) with a 5.5% operating margin. Commercial net revenue decreased 6% and Consumer net revenue increased by 42%. Total units were up 11% with Notebooks units up 32% and Desktops units down 30%.
- Printing net revenue was down 20% year over year (down 19% in constant currency) with a 12.2% operating margin. Total hardware units were down 2% with Commercial hardware units down 32% and Consumer hardware units up 3%. Supplies net revenue was down 19% (down 18% in constant currency).
Asset management
HP’s net cash provided by operating activities in the third quarter of fiscal 2020 was $1.7 billion. Accounts receivable ended the quarter at $5.3 billion, down 4 days quarter over quarter to 33 days. Inventory ended the quarter at $5.9 billion, down 12 days quarter over quarter to 45 days. Accounts payable ended the quarter at $14.3 billion, down 20 days quarter over quarter to 108 days.
HP generated $1.6 billion of free cash flow in the third quarter. Free cash flow includes net cash provided by operating activities of $1.7 billion adjusted for net investment in leases of $27 million and net investment in property, plant & equipment of $117 million.
HP’s dividend payment of $0.1762 per share in the third quarter resulted in cash usage of $251 million. HP also utilized $953 million of cash during the quarter to repurchase approximately 56 million shares of common stock in the open market. HP exited the quarter with $4.9 billion in gross cash, which includes cash and cash equivalents and short-term investments of $0.2 billion included in other current assets.
Outlook
For the fiscal 2020 fourth quarter, HP estimates GAAP diluted net EPS to be in the range of $0.32 to $0.36 and non-GAAP diluted net EPS to be in the range of $0.50 to $0.54. Fiscal 2020 Fourth quarter non-GAAP diluted net EPS estimates exclude $0.18 per diluted share, primarily related to restructuring and other charges, acquisition-related charges, defined benefit plan settlement charges, amortization of intangible assets, non-operating retirement-related (credits)/charges, tax adjustments and the related tax impact on these items.
For fiscal 2020, HP estimates GAAP diluted net EPS to be in the range of $1.83 to $1.87 and non-GAAP diluted net EPS to be in the range of $2.16 to $2.20. Fiscal 2020 non-GAAP diluted net EPS estimates exclude $0.33 per diluted share, primarily related to restructuring and other charges, acquisition-related charges, defined benefit plan settlement charges, amortization of intangible assets, non-operating retirement-related (credits)/charges, debt extinguishment costs, tax adjustments and the related tax impact on these items. HP also estimates fiscal 2020 free cash flow to be in the range of $2.5 to $3.0 billion.
More information on HP’s earnings, including additional financial analysis and an earnings overview presentation, is available on HP’s Investor Relations website at investor.hp.com.
Related:
Comment:
Please leave your comments below about this story “HP Beats Q3 with Strong Results“.


Leave a Comment
Want to join the discussion?Feel free to contribute!